了解 CUDA 記憶體使用
為了偵錯 CUDA 記憶體使用情況,PyTorch 提供了一種產生記憶體快照的方法,該快照記錄了在任何時間點已分配 CUDA 記憶體的狀態,並可選擇記錄導致該快照的分配事件的歷史記錄。
然後,可以將產生的快照拖放到託管在 pytorch.org/memory_viz 上的互動式檢視器中,該檢視器可用於瀏覽快照。
產生快照
記錄快照的常見模式是啟用記憶體歷史記錄、執行要觀察的程式碼,然後儲存包含已 pickled 快照的檔案
# enable memory history, which will
# add tracebacks and event history to snapshots
torch.cuda.memory._record_memory_history()

run_your_code()
torch.cuda.memory._dump_snapshot("my_snapshot.pickle")
使用視覺化工具
開啟 pytorch.org/memory_viz,並將 pickled 格式的快照檔案拖放到視覺化工具中。該視覺化工具是一個 JavaScript 應用程式,會在您的電腦本機執行。它不會上傳任何快照資料。
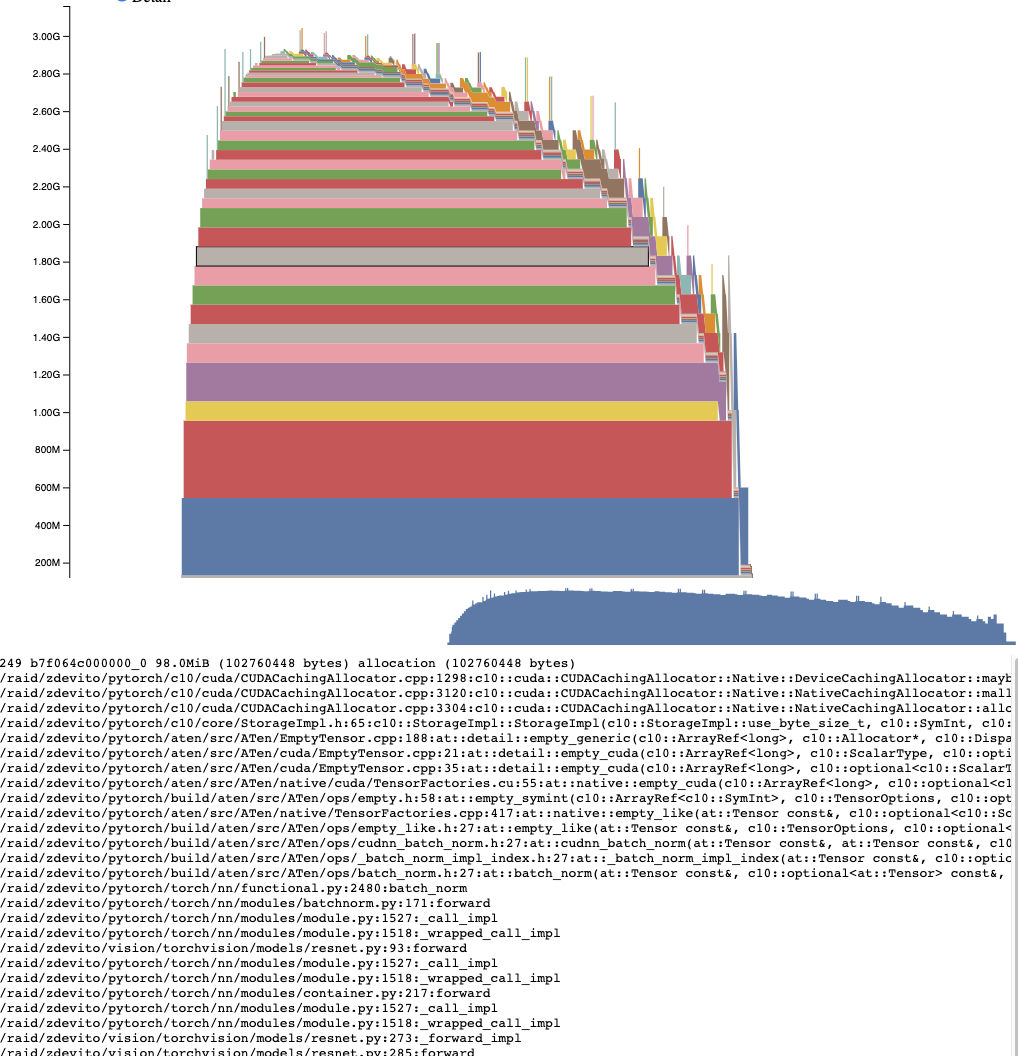
作用中記憶體時間軸
作用中記憶體時間軸會在快照中顯示特定 GPU 上所有存活張量在一段時間內的狀態。在圖表上平移/縮放以查看較小的記憶體配置。將滑鼠游標停留在已配置的區塊上,即可查看該區塊配置時的堆疊追蹤,以及其位址等詳細資訊。您可以調整詳細資訊滑桿,以減少呈現的記憶體配置,並在有大量資料時提高效能。
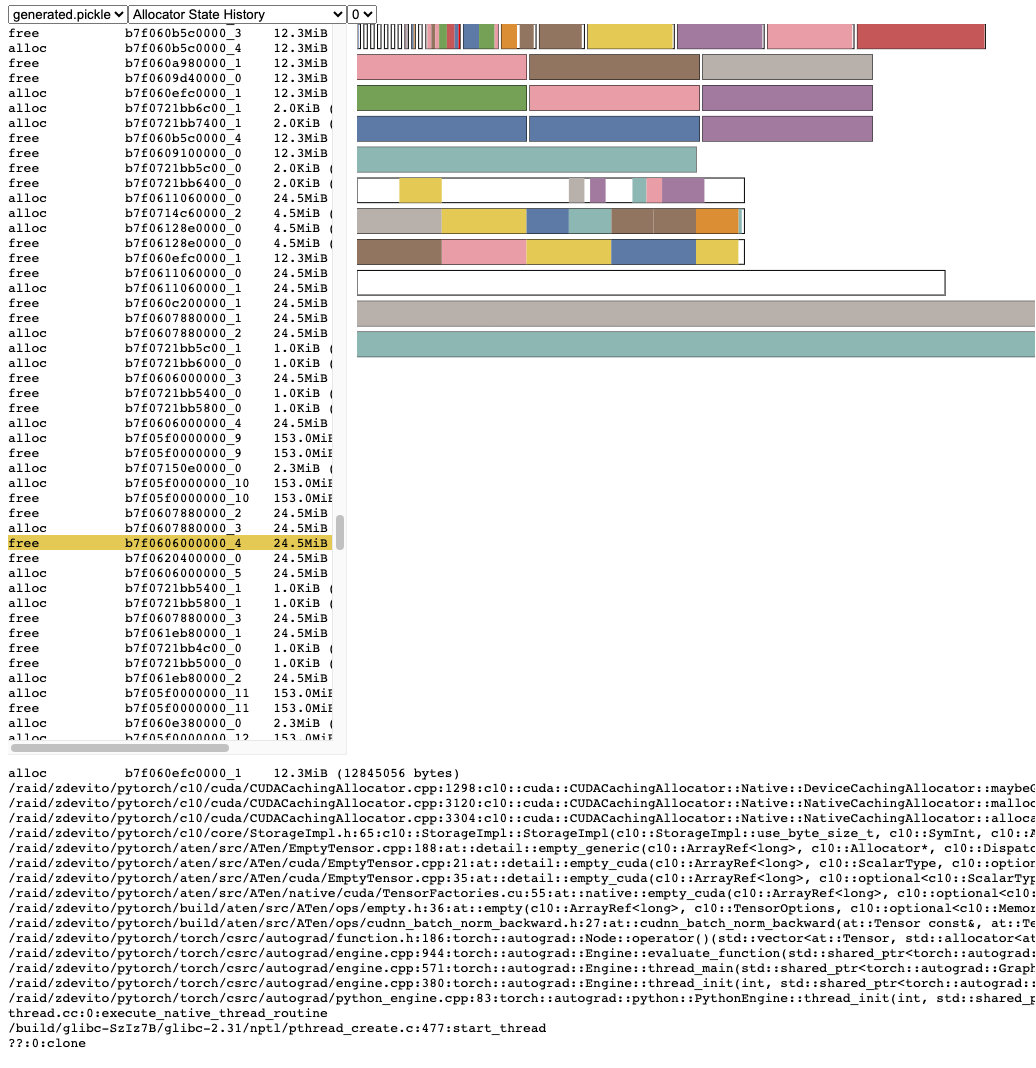
記憶體配置器狀態歷史記錄
記憶體配置器狀態歷史記錄會在左側的時間軸中顯示個別的記憶體配置器事件。在時間軸中選取一個事件,即可查看該事件發生時的記憶體配置器狀態的視覺摘要。此摘要會顯示從 cudaMalloc 傳回的每個區段,以及它如何分割成個別記憶體配置或可用空間的區塊。將滑鼠游標停留在區段和區塊上,即可查看配置記憶體時的堆疊追蹤。將滑鼠游標停留在事件上,即可查看事件發生時的堆疊追蹤,例如張量被釋放時。記憶體不足錯誤會回報為 OOM 事件。查看 OOM 期間的記憶體狀態,可能有助於了解為何即使仍然存在保留的記憶體,記憶體配置仍會失敗。
堆疊追蹤資訊也會報告記憶體配置發生的位址。位址 b7f064c000000_0 指的是位址 7f064c000000 上的 (b)lock,這是這個位址第 "_0" 次被配置。可以在作用中記憶體時間軸中查找此唯一字串,並在作用中狀態歷史記錄中搜尋,以檢查張量被配置或釋放時的記憶體狀態。
快照 API 參考
- torch.cuda.memory._record_memory_history(enabled='all', context='all', stacks='all', max_entries=9223372036854775807, device=None)[source][source]
啟用與記憶體配置相關聯的堆疊追蹤記錄,以便您可以知道
torch.cuda.memory._snapshot()中任何記憶體片段的配置者。除了保留每個目前記憶體配置和釋放的堆疊追蹤之外,這還會啟用所有 alloc/free 事件的歷史記錄記錄。
使用
torch.cuda.memory._snapshot()來檢索此資訊,並使用 _memory_viz.py 中的工具來視覺化快照。Python 追蹤收集速度很快(每次追蹤 2us),因此如果您預期將來需要偵錯記憶體問題,您可以考慮在生產作業中啟用此功能。
C++ 追蹤收集速度也很快(~50ns/frame),對於許多典型的程式來說,每次追蹤大約需要 ~2us,但可能會因堆疊深度而異。
- 參數
enabled (Literal[None, "state", "all"], optional) – None,停用記錄記憶體歷史記錄。“state”,保留目前配置記憶體的資訊。“all”,另外保留所有 alloc/free 呼叫的歷史記錄。預設為 “all”。
context (Literal[None, "state", "alloc", "all"], optional) – None,不記錄任何追溯。“state”,記錄目前配置記憶體的追溯。“alloc”,另外保留 alloc 呼叫的追溯。“all”,另外保留 free 呼叫的追溯。預設為 “all”。
stacks (Literal["python", "all"], optional) – “python”,在追溯中包含 Python、TorchScript 和 inductor frame。“all”,另外包含 C++ frame。預設為 “all”。
max_entries (int, optional) – 在記錄的歷史記錄中最多保留 max_entries 個 alloc/free 事件。
- torch.cuda.memory._snapshot(device=None)[source][source]
儲存呼叫時 CUDA 記憶體狀態的快照。
該狀態表示為具有以下結構的字典。
class Snapshot(TypedDict):
    segments : List[Segment]
    device_traces: List[List[TraceEntry]]

class Segment(TypedDict):
    # Segments are memory returned from a cudaMalloc call.
    # The size of reserved memory is the sum of all Segments.
    # Segments are cached and reused for future allocations.
    # If the reuse is smaller than the segment, the segment
    # is split into more then one Block.
    # empty_cache() frees Segments that are entirely inactive.
    address: int
    total_size: int #  cudaMalloc'd size of segment
    stream: int
    segment_type: Literal['small', 'large'] # 'large' (>1MB)
    allocated_size: int # size of memory in use
    active_size: int # size of memory in use or in active_awaiting_free state
    blocks : List[Block]

class Block(TypedDict):
    # A piece of memory returned from the allocator, or
    # current cached but inactive.
    size: int
    requested_size: int # size requested during malloc, may be smaller than
                        # size due to rounding
    address: int
    state: Literal['active_allocated', # used by a tensor
                'active_awaiting_free', # waiting for another stream to finish using
                                        # this, then it will become free
                'inactive',] # free for reuse
    frames: List[Frame] # stack trace from where the allocation occurred

class Frame(TypedDict):
        filename: str
        line: int
        name: str

class TraceEntry(TypedDict):
    # When `torch.cuda.memory._record_memory_history()` is enabled,
    # the snapshot will contain TraceEntry objects that record each
    # action the allocator took.
    action: Literal[
    'alloc'  # memory allocated
    'free_requested', # the allocated received a call to free memory
    'free_completed', # the memory that was requested to be freed is now
                    # able to be used in future allocation calls
    'segment_alloc', # the caching allocator ask cudaMalloc for more memory
                    # and added it as a segment in its cache
    'segment_free',  # the caching allocator called cudaFree to return memory
                    # to cuda possibly trying free up memory to
                    # allocate more segments or because empty_caches was called
    'oom',          # the allocator threw an OOM exception. 'size' is
                    # the requested number of bytes that did not succeed
    'snapshot'      # the allocator generated a memory snapshot
                    # useful to coorelate a previously taken
                    # snapshot with this trace
    ]
    addr: int # not present for OOM
    frames: List[Frame]
    size: int
    stream: int
    device_free: int # only present for OOM, the amount of
                    # memory cuda still reports to be free
- 傳回
快照字典物件
