Inspector APIs
概觀
Inspector API 提供了一個方便的介面,用於分析 ETRecord 和 ETDump 的內容,幫助開發者深入了解模型架構和效能統計。它建立在 EventBlock Class 資料結構之上,該結構組織了一組 Event,以便輕鬆存取 profiling 事件的詳細資訊。
使用者可以透過多種方式與 Inspector API 互動:
請參閱 e2e 使用案例文件,以了解如何在真實世界的範例中使用這些功能。
Inspector Methods
Constructor
- executorch.devtools.Inspector.__init__(self, etdump_path=None, etdump_data=None, etrecord=None, source_time_scale=TimeScale.NS, target_time_scale=TimeScale.MS, debug_buffer_path=None, delegate_metadata_parser=None, delegate_time_scale_converter=None, enable_module_hierarchy=False)
使用從提供的 ETDump 路徑或二進制檔以及可選的 ETRecord 路徑中獲取的資料來初始化 Inspector 實例,底層資料會填充到 EventBlock 中。
- 參數
etdump_path – ETDump 檔案的路徑。應該提供此參數或 etdump_data。
etdump_data – ETDump 二進制檔。應該提供此參數或 etdump_path。
etrecord – 可選的 ETRecord 物件或 ETRecord 檔案的路徑。
source_time_scale – 從 runtime 檢索的效能資料的時間刻度。runtime 中的預設時間 hook 實作會傳回 NS。
target_time_scale – 使用者希望將其效能資料轉換成的目標時間刻度。預設為 MS。
debug_buffer_path – Debug buffer 檔案路徑,其中包含 ETDump 參考的中間和程式輸出的 debug 資料。
delegate_metadata_parser – 可選的函數,用於解析來自 Profiling Event 的委派中繼資料。函數的預期簽名為:(delegate_metadata_list: List[bytes]) -> Union[List[str], Dict[str, Any]]
delegate_time_scale_converter – 可選的函數,用於轉換委派 profiling 資料的時間刻度。如果未提供,則使用 target_time_scale/source_time_scale 的轉換比率。
enable_module_hierarchy – 在運算子圖中啟用子模組。預設為 False。
- 傳回
None
範例用法
from executorch.devtools import Inspector

inspector = Inspector(etdump_path="/path/to/etdump.etdp", etrecord="/path/to/etrecord.bin")
to_dataframe
- executorch.devtools.Inspector.to_dataframe(self, include_units=True, include_delegate_debug_data=False)
- 參數
include_units – 標頭是否應包含單位(預設為 true)
include_delegate_debug_data – 是否包含委派 debug 中繼資料(預設為 false)
- 傳回
傳回 inspector 中每個 EventBlock 中 Events 的 pandas DataFrame,其中每列代表一個 Event。
print_data_tabular
- executorch.devtools.Inspector.print_data_tabular(self, file=<sphinx_gallery.gen_rst._LoggingTee object>, include_units=True, include_delegate_debug_data=False)
以結構化的表格格式顯示底層 EventBlocks,其中每列代表一個 Event。
- 參數
file – 要列印到的 IO stream。預設為 stdout。如果這是 IPython 環境(例如 Jupyter notebook),則不使用。
include_units – 標頭是否應包含單位(預設為 true)
include_delegate_debug_data – 是否包含委派 debug 中繼資料(預設為 false)
- 傳回
None
範例用法
inspector.print_data_tabular()
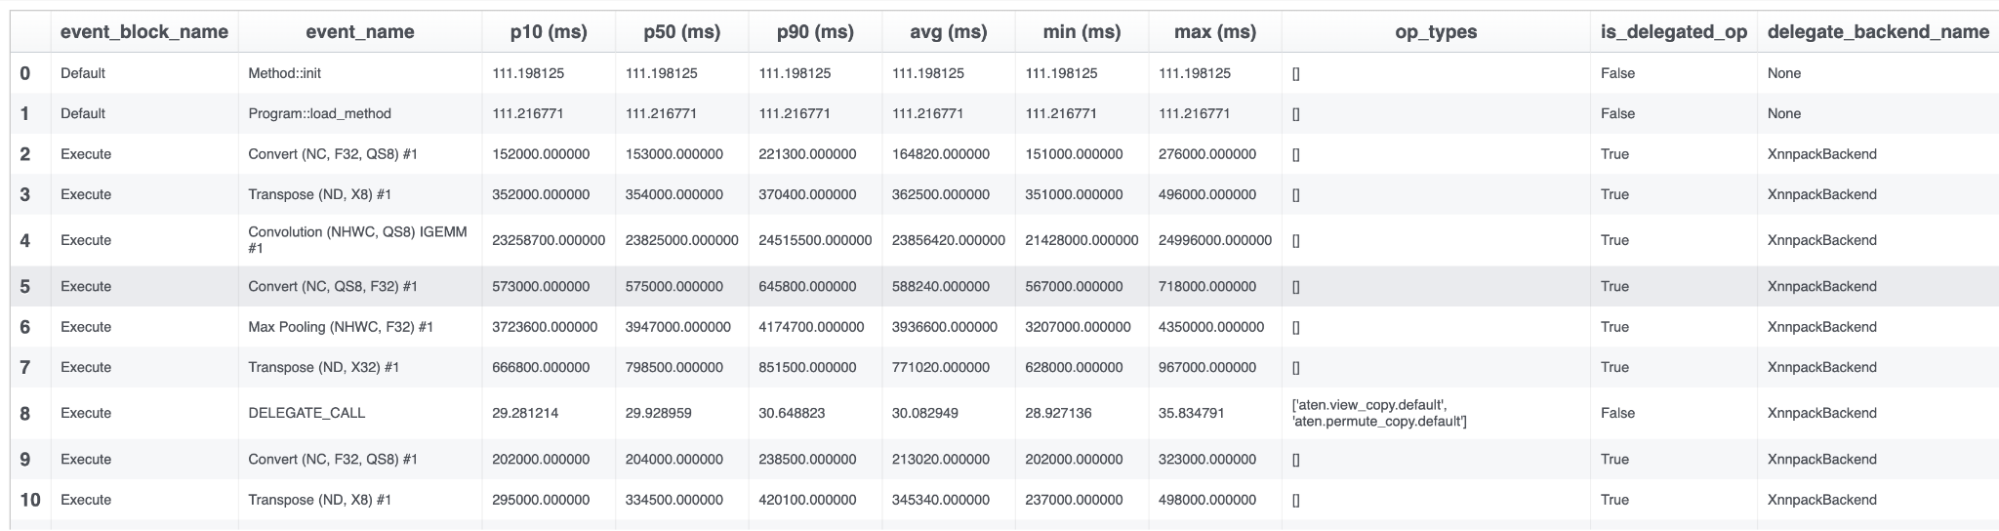
請注意,委派 profiling 事件的單位是「cycles」。我們正在努力提供一種在未來設定不同單位的方法。
find_total_for_module
- executorch.devtools.Inspector.find_total_for_module(self, module_name)
傳回指定模組中所有運算子的總平均運算時間。
- 參數
module_name – 要聚合的模組名稱。
- 傳回
模組中所有運算子的平均運算時間(以秒為單位)的總和,模組的名稱為 "module_name"。
範例用法
print(inspector.find_total_for_module("L__self___conv_layer"))
0.002
get_exported_program
- executorch.devtools.Inspector.get_exported_program(self, graph=None)
ETRecord 的存取 helper,預設傳回 Edge Dialect 程式。
- 參數
graph (圖表) – 可選的圖表名稱,用於存取。如果為 None,則傳回 Edge Dialect 程式。
- 傳回
“graph (圖表)”的 ExportedProgram 物件。
範例用法
print(inspector.get_exported_program())
ExportedProgram:
    class GraphModule(torch.nn.Module):
        def forward(self, arg0_1: f32[4, 3, 64, 64]):
            # No stacktrace found for following nodes
            _param_constant0 = self._param_constant0
            _param_constant1 = self._param_constant1

            ### ... Omit part of the program for documentation readability ... ###

Graph signature: ExportGraphSignature(parameters=[], buffers=[], user_inputs=['arg0_1'], user_outputs=['aten_tan_default'], inputs_to_parameters={}, inputs_to_buffers={}, buffers_to_mutate={}, backward_signature=None, assertion_dep_token=None)
Range constraints: {}
Equality constraints: []
檢測器屬性
EventBlock 類別
透過 Inspector 實例的 event_blocks 屬性來存取 EventBlock 實例,例如:
inspector.event_blocks
- class executorch.devtools.inspector.EventBlock(name, events=<factory>, source_time_scale=TimeScale.NS, target_time_scale=TimeScale.MS, bundled_input_index=None, run_output=None, reference_output=None)[原始碼]
EventBlock 包含與從運行時檢索的特定分析/偵錯區塊相關聯的事件集合。每個 EventBlock 代表一種執行模式。例如,模型初始化和載入位於單個 EventBlock 中。如果存在控制流,則每個分支將由單獨的 EventBlock 表示。
- 參數
name (名稱) – 分析/偵錯區塊的名稱。
events (事件) – 與分析/偵錯區塊相關聯的 Event 列表。
bundled_input_idx (捆綁輸入索引) – 此 EventBlock 對應的 Bundled Input 的索引。
run_output (執行輸出) – 從封裝事件中提取的執行輸出
Event 類別
透過 EventBlock 實例的 events 屬性來存取 Event 實例。
- class executorch.devtools.inspector.Event(name, perf_data=None, op_types=<factory>, delegate_debug_identifier=None, debug_handles=None, stack_traces=<factory>, module_hierarchy=<factory>, is_delegated_op=None, delegate_backend_name=None, _delegate_debug_metadatas=<factory>, debug_data=<factory>, _instruction_id=None, _delegate_metadata_parser=None, _delegate_time_scale_converter=None)[原始碼]
Event 對應於一個運算符實例,其中包含從運行時檢索的效能資料以及來自 ETRecord 的其他元資料。
- 參數
name (名稱) – 分析 Event 的名稱,如果沒有分析事件,則為空。
perf_data (效能資料) – 與從運行時檢索的事件相關聯的效能資料 (可用屬性:p10、p50、p90、avg、min 和 max)。
op_type (運算符類型) – 對應於事件的運算符類型列表。
delegate_debug_identifier (委派偵錯識別符) – 與指令 ID 結合使用的補充識別符。
debug_handles (偵錯句柄) – 模型圖中與此事件相關聯的偵錯句柄。
stack_trace (堆疊追蹤) – 一個字典,將每個關聯的運算符的名稱映射到其堆疊追蹤。
module_hierarchy (模組層級) – 一個字典,將每個關聯的運算符的名稱映射到其模組層級。
is_delegated_op (是否為委派運算符) – 事件是否已委派。
delegate_backend_name (委派後端名稱) – 此事件委派到的後端的名稱。
_delegate_debug_metadatas (委派偵錯元資料) – 一個包含原始委派偵錯元資料字串的列表,每個分析事件對應一個。 可作為 Event.delegate_debug_metadatas (如果提供了分析器) 或 Event.raw_delegate_debug_metadatas 取得
debug_data (偵錯資料) – 包含收集的中間資料的列表。
_instruction_id (指令 ID) – 用於符號化的指令識別符
_delegate_metadata_parser (委派元資料分析器) – 用於 _delegate_debug_metadatas 的可選分析器
範例用法
for event_block in inspector.event_blocks:
    for event in event_block.events:
        if event.name == "Method::execute":
            print(event.perf_data.raw)
[175.748, 78.678, 70.429, 122.006, 97.495, 67.603, 70.2, 90.139, 66.344, 64.575, 134.135, 93.85, 74.593, 83.929, 75.859, 73.909, 66.461, 72.102, 84.142, 77.774, 70.038, 80.246, 59.134, 68.496, 67.496, 100.491, 81.162, 74.53, 70.709, 77.112, 59.775, 79.674, 67.54, 79.52, 66.753, 70.425, 71.703, 81.373, 72.306, 72.404, 94.497, 77.588, 79.835, 68.597, 71.237, 88.528, 71.884, 74.047, 81.513, 76.116]
CLI
在您的終端機中執行以下指令以顯示資料表。此指令會產生與呼叫先前提及的 print_data_tabular 相同的表格輸出
python3 -m devtools.inspector.inspector_cli --etdump_path <path_to_etdump> --etrecord_path <path_to_etrecord>
請注意,etrecord_path 參數是可選的。
我們計劃在未來擴展 CLI 的功能。
