


注意
點擊這裡下載完整的範例程式碼
音訊重採樣
作者: Caroline Chen, Moto Hira
本教學展示如何使用 torchaudio 的重採樣 API。
import torch
import torchaudio
import torchaudio.functional as F
import torchaudio.transforms as T

print(torch.__version__)
print(torchaudio.__version__)
2.6.0
2.6.0
準備工作
首先,我們匯入模組並定義輔助函式。
import math
import timeit

import librosa
import matplotlib.colors as mcolors
import matplotlib.pyplot as plt
import pandas as pd
import resampy
from IPython.display import Audio

pd.set_option("display.max_rows", None)
pd.set_option("display.max_columns", None)

DEFAULT_OFFSET = 201


def _get_log_freq(sample_rate, max_sweep_rate, offset):
    """Get freqs evenly spaced out in log-scale, between [0, max_sweep_rate // 2]

    offset is used to avoid negative infinity `log(offset + x)`.

    """
    start, stop = math.log(offset), math.log(offset + max_sweep_rate // 2)
    return torch.exp(torch.linspace(start, stop, sample_rate, dtype=torch.double)) - offset


def _get_inverse_log_freq(freq, sample_rate, offset):
    """Find the time where the given frequency is given by _get_log_freq"""
    half = sample_rate // 2
    return sample_rate * (math.log(1 + freq / offset) / math.log(1 + half / offset))


def _get_freq_ticks(sample_rate, offset, f_max):
    # Given the original sample rate used for generating the sweep,
    # find the x-axis value where the log-scale major frequency values fall in
    times, freq = [], []
    for exp in range(2, 5):
        for v in range(1, 10):
            f = v * 10**exp
            if f < sample_rate // 2:
                t = _get_inverse_log_freq(f, sample_rate, offset) / sample_rate
                times.append(t)
                freq.append(f)
    t_max = _get_inverse_log_freq(f_max, sample_rate, offset) / sample_rate
    times.append(t_max)
    freq.append(f_max)
    return times, freq


def get_sine_sweep(sample_rate, offset=DEFAULT_OFFSET):
    max_sweep_rate = sample_rate
    freq = _get_log_freq(sample_rate, max_sweep_rate, offset)
    delta = 2 * math.pi * freq / sample_rate
    cummulative = torch.cumsum(delta, dim=0)
    signal = torch.sin(cummulative).unsqueeze(dim=0)
    return signal


def plot_sweep(
    waveform,
    sample_rate,
    title,
    max_sweep_rate=48000,
    offset=DEFAULT_OFFSET,
):
    x_ticks = [100, 500, 1000, 5000, 10000, 20000, max_sweep_rate // 2]
    y_ticks = [1000, 5000, 10000, 20000, sample_rate // 2]

    time, freq = _get_freq_ticks(max_sweep_rate, offset, sample_rate // 2)
    freq_x = [f if f in x_ticks and f <= max_sweep_rate // 2 else None for f in freq]
    freq_y = [f for f in freq if f in y_ticks and 1000 <= f <= sample_rate // 2]

    figure, axis = plt.subplots(1, 1)
    _, _, _, cax = axis.specgram(waveform[0].numpy(), Fs=sample_rate)
    plt.xticks(time, freq_x)
    plt.yticks(freq_y, freq_y)
    axis.set_xlabel("Original Signal Frequency (Hz, log scale)")
    axis.set_ylabel("Waveform Frequency (Hz)")
    axis.xaxis.grid(True, alpha=0.67)
    axis.yaxis.grid(True, alpha=0.67)
    figure.suptitle(f"{title} (sample rate: {sample_rate} Hz)")
    plt.colorbar(cax)
重採樣概觀
若要將音訊波形從一個頻率重採樣到另一個頻率,您可以使用 torchaudio.transforms.Resample 或 torchaudio.functional.resample()。transforms.Resample 會預先計算並快取用於重採樣的 kernel,而 functional.resample 會即時計算,因此當使用相同參數重採樣多個波形時,使用 torchaudio.transforms.Resample 會加速 (請參閱基準測試章節)。
兩種重採樣方法都使用 bandlimited sinc 插值來計算任意時間步長的訊號值。該實作涉及卷積,因此我們可以利用 GPU / 多執行緒來提高效能。
注意
當在多個子行程中使用重採樣時,例如使用多個 worker 行程載入資料時,您的應用程式可能會建立比系統可以有效處理的更多執行緒。 在這種情況下,設定 torch.set_num_threads(1) 可能會有幫助。
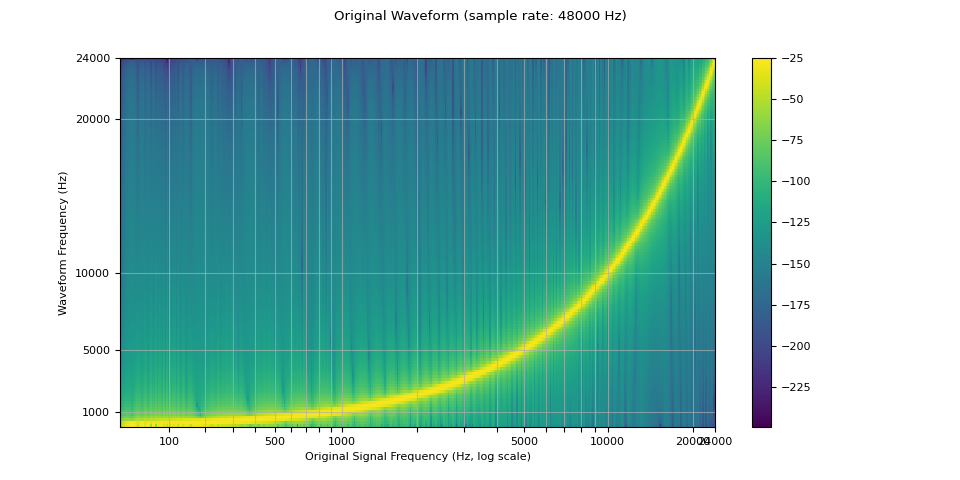
由於有限數量的樣本只能代表有限數量的頻率,因此重採樣不會產生完美結果,並且可以使用各種參數來控制其品質和計算速度。 我們透過重採樣對數正弦波掃描來展示這些屬性,對數正弦波掃描是一個隨著時間呈指數增長的頻率的正弦波。
下面的頻譜圖顯示了訊號的頻率表示,其中 x 軸對應於原始波形的頻率 (以對數刻度),y 軸為繪製波形的頻率,顏色強度為振幅。
sample_rate = 48000
waveform = get_sine_sweep(sample_rate)

plot_sweep(waveform, sample_rate, title="Original Waveform")
Audio(waveform.numpy()[0], rate=sample_rate)
現在我們重採樣 (降採樣) 它。
我們可以看到,在重新取樣波形的光譜圖中,出現了原始波形中沒有的人為雜訊。這種效應稱為混疊(aliasing)。這個頁面解釋了它是如何發生的,以及為什麼它看起來像一個反射。
resample_rate = 32000
resampler = T.Resample(sample_rate, resample_rate, dtype=waveform.dtype)
resampled_waveform = resampler(waveform)

plot_sweep(resampled_waveform, resample_rate, title="Resampled Waveform")
Audio(resampled_waveform.numpy()[0], rate=resample_rate)

使用參數控制重新取樣品質
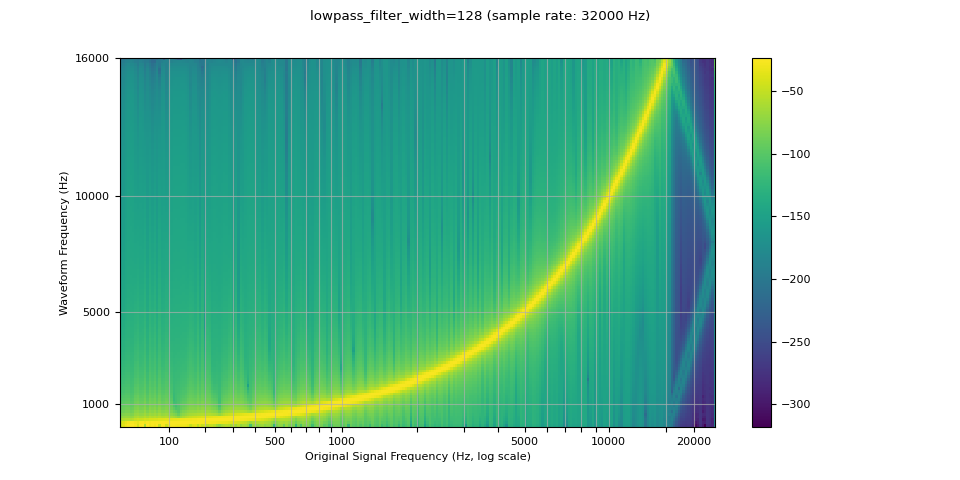
低通濾波器寬度
由於用於插值的濾波器無限延伸,lowpass_filter_width 參數用於控制用於視窗化插值的濾波器寬度。它也被稱為零交越數,因為插值在每個時間單位穿過零。 使用較大的 lowpass_filter_width 可以提供更清晰、更精確的濾波器,但計算成本更高。
sample_rate = 48000
resample_rate = 32000

resampled_waveform = F.resample(waveform, sample_rate, resample_rate, lowpass_filter_width=6)
plot_sweep(resampled_waveform, resample_rate, title="lowpass_filter_width=6")

resampled_waveform = F.resample(waveform, sample_rate, resample_rate, lowpass_filter_width=128)
plot_sweep(resampled_waveform, resample_rate, title="lowpass_filter_width=128")
滾降(Rolloff)
rolloff 參數表示為奈奎斯特頻率的一部分,奈奎斯特頻率是給定有限取樣率可表示的最大頻率。 rolloff 決定了低通濾波器的截止頻率,並控制混疊的程度,當高於奈奎斯特頻率的頻率被映射到較低頻率時會發生混疊。 因此,較低的滾降將減少混疊的量,但也會減少一些較高的頻率。
sample_rate = 48000
resample_rate = 32000

resampled_waveform = F.resample(waveform, sample_rate, resample_rate, rolloff=0.99)
plot_sweep(resampled_waveform, resample_rate, title="rolloff=0.99")

resampled_waveform = F.resample(waveform, sample_rate, resample_rate, rolloff=0.8)
plot_sweep(resampled_waveform, resample_rate, title="rolloff=0.8")

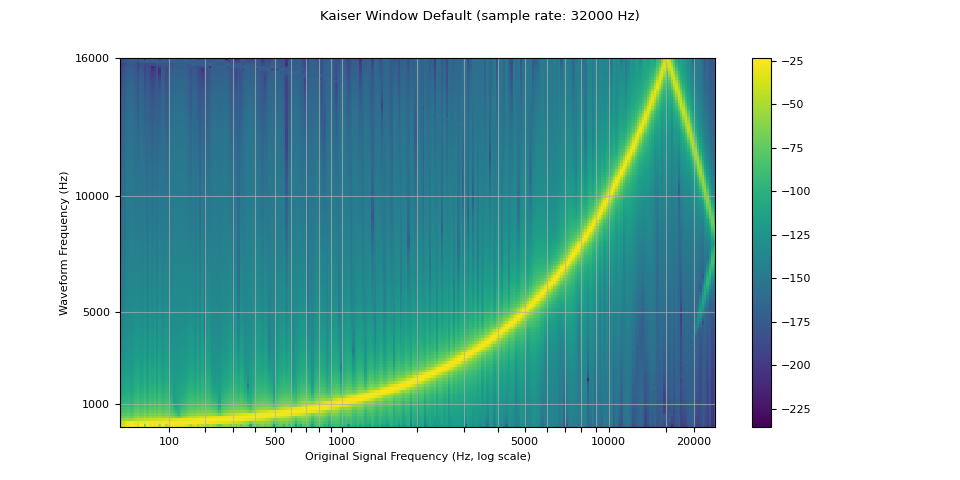
視窗函數
預設情況下,torchaudio 的重新取樣使用 Hann 視窗濾波器,這是一種加權餘弦函數。 它還支持 Kaiser 視窗,這是一個接近最佳的視窗函數,包含一個額外的 beta 參數,可用於設計濾波器的平滑度和脈衝寬度。 這可以使用 resampling_method 參數來控制。
sample_rate = 48000
resample_rate = 32000

resampled_waveform = F.resample(waveform, sample_rate, resample_rate, resampling_method="sinc_interp_hann")
plot_sweep(resampled_waveform, resample_rate, title="Hann Window Default")

resampled_waveform = F.resample(waveform, sample_rate, resample_rate, resampling_method="sinc_interp_kaiser")
plot_sweep(resampled_waveform, resample_rate, title="Kaiser Window Default")
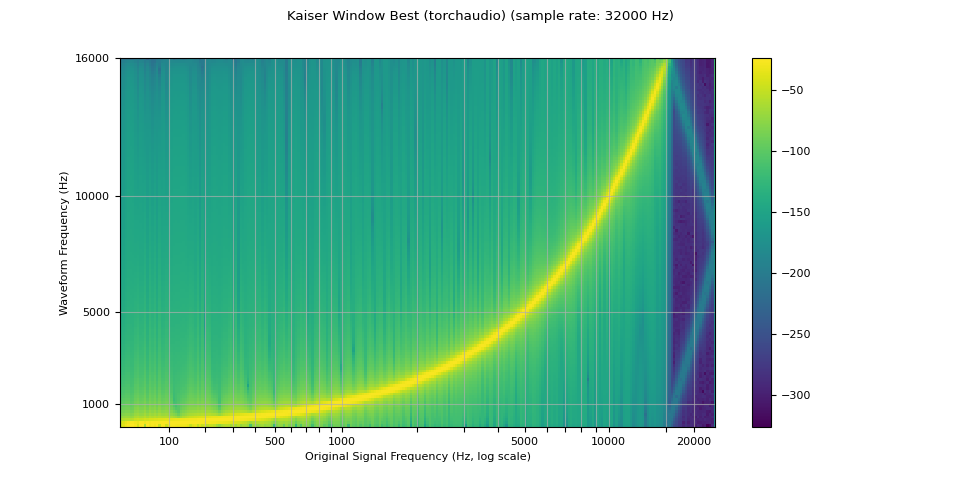
與 librosa 的比較
torchaudio 的重新取樣函數可用於產生與 librosa (resampy) 的 kaiser 視窗重新取樣相似的結果,但有一些雜訊。
sample_rate = 48000
resample_rate = 32000
kaiser_best
resampled_waveform = F.resample(
    waveform,
    sample_rate,
    resample_rate,
    lowpass_filter_width=64,
    rolloff=0.9475937167399596,
    resampling_method="sinc_interp_kaiser",
    beta=14.769656459379492,
)
plot_sweep(resampled_waveform, resample_rate, title="Kaiser Window Best (torchaudio)")
librosa_resampled_waveform = torch.from_numpy(
    librosa.resample(waveform.squeeze().numpy(), orig_sr=sample_rate, target_sr=resample_rate, res_type="kaiser_best")
).unsqueeze(0)
plot_sweep(librosa_resampled_waveform, resample_rate, title="Kaiser Window Best (librosa)")

mse = torch.square(resampled_waveform - librosa_resampled_waveform).mean().item()
print("torchaudio and librosa kaiser best MSE:", mse)
torchaudio and librosa kaiser best MSE: 2.0806901153660115e-06
kaiser_fast
resampled_waveform = F.resample(
    waveform,
    sample_rate,
    resample_rate,
    lowpass_filter_width=16,
    rolloff=0.85,
    resampling_method="sinc_interp_kaiser",
    beta=8.555504641634386,
)
plot_sweep(resampled_waveform, resample_rate, title="Kaiser Window Fast (torchaudio)")
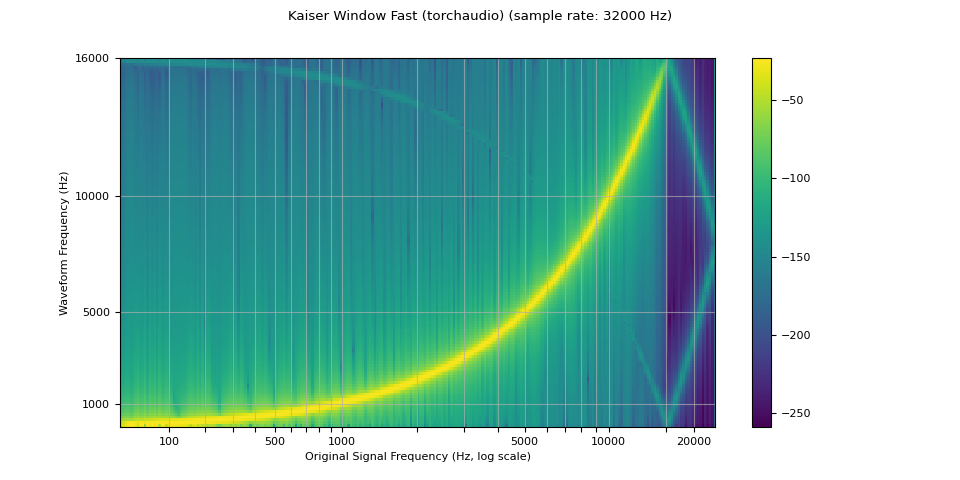
librosa_resampled_waveform = torch.from_numpy(
    librosa.resample(waveform.squeeze().numpy(), orig_sr=sample_rate, target_sr=resample_rate, res_type="kaiser_fast")
).unsqueeze(0)
plot_sweep(librosa_resampled_waveform, resample_rate, title="Kaiser Window Fast (librosa)")
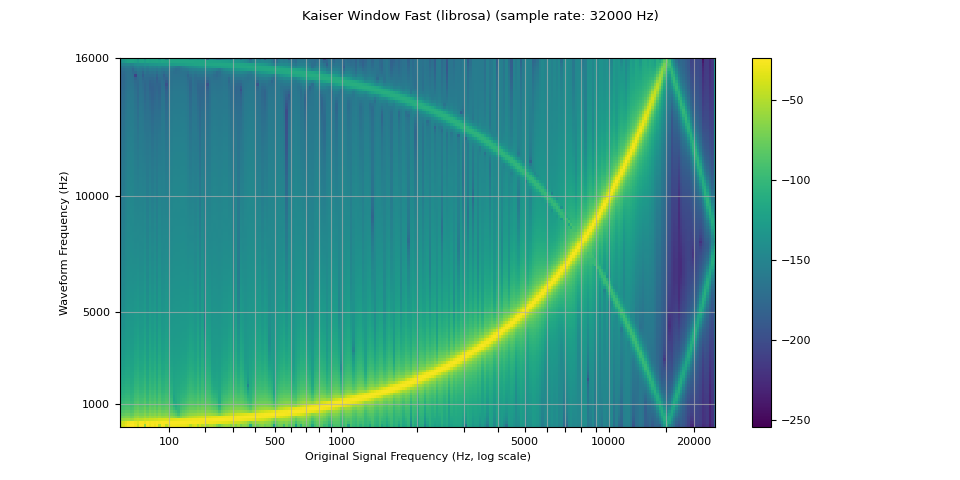
mse = torch.square(resampled_waveform - librosa_resampled_waveform).mean().item()
print("torchaudio and librosa kaiser fast MSE:", mse)
torchaudio and librosa kaiser fast MSE: 2.5200744248601437e-05
效能基準測試
以下是兩個取樣率對之間對波形進行降取樣和升取樣的基準測試。 我們演示了 lowpass_filter_width、視窗類型和取樣率可能產生的效能影響。 此外,我們將其與 librosa 的 kaiser_best 和 kaiser_fast 進行比較,並使用 torchaudio 中對應的參數。
print(f"torchaudio: {torchaudio.__version__}")
print(f"librosa: {librosa.__version__}")
print(f"resampy: {resampy.__version__}")
torchaudio: 2.6.0
librosa: 0.10.0
resampy: 0.2.2
def benchmark_resample_functional(
    waveform,
    sample_rate,
    resample_rate,
    lowpass_filter_width=6,
    rolloff=0.99,
    resampling_method="sinc_interp_hann",
    beta=None,
    iters=5,
):
    return (
        timeit.timeit(
            stmt="""
torchaudio.functional.resample(
    waveform,
    sample_rate,
    resample_rate,
    lowpass_filter_width=lowpass_filter_width,
    rolloff=rolloff,
    resampling_method=resampling_method,
    beta=beta,
)
        """,
            setup="import torchaudio",
            number=iters,
            globals=locals(),
        )
        * 1000
        / iters
    )
def benchmark_resample_transforms(
    waveform,
    sample_rate,
    resample_rate,
    lowpass_filter_width=6,
    rolloff=0.99,
    resampling_method="sinc_interp_hann",
    beta=None,
    iters=5,
):
    return (
        timeit.timeit(
            stmt="resampler(waveform)",
            setup="""
import torchaudio

resampler = torchaudio.transforms.Resample(
    sample_rate,
    resample_rate,
    lowpass_filter_width=lowpass_filter_width,
    rolloff=rolloff,
    resampling_method=resampling_method,
    dtype=waveform.dtype,
    beta=beta,
)
resampler.to(waveform.device)
        """,
            number=iters,
            globals=locals(),
        )
        * 1000
        / iters
    )
def benchmark_resample_librosa(
    waveform,
    sample_rate,
    resample_rate,
    res_type=None,
    iters=5,
):
    waveform_np = waveform.squeeze().numpy()
    return (
        timeit.timeit(
            stmt="""
librosa.resample(
    waveform_np,
    orig_sr=sample_rate,
    target_sr=resample_rate,
    res_type=res_type,
)
        """,
            setup="import librosa",
            number=iters,
            globals=locals(),
        )
        * 1000
        / iters
    )
def benchmark(sample_rate, resample_rate):
    times, rows = [], []
    waveform = get_sine_sweep(sample_rate).to(torch.float32)

    args = (waveform, sample_rate, resample_rate)

    # sinc 64 zero-crossings
    f_time = benchmark_resample_functional(*args, lowpass_filter_width=64)
    t_time = benchmark_resample_transforms(*args, lowpass_filter_width=64)
    times.append([None, f_time, t_time])
    rows.append("sinc (width 64)")

    # sinc 6 zero-crossings
    f_time = benchmark_resample_functional(*args, lowpass_filter_width=16)
    t_time = benchmark_resample_transforms(*args, lowpass_filter_width=16)
    times.append([None, f_time, t_time])
    rows.append("sinc (width 16)")

    # kaiser best
    kwargs = {
        "lowpass_filter_width": 64,
        "rolloff": 0.9475937167399596,
        "resampling_method": "sinc_interp_kaiser",
        "beta": 14.769656459379492,
    }
    lib_time = benchmark_resample_librosa(*args, res_type="kaiser_best")
    f_time = benchmark_resample_functional(*args, **kwargs)
    t_time = benchmark_resample_transforms(*args, **kwargs)
    times.append([lib_time, f_time, t_time])
    rows.append("kaiser_best")

    # kaiser fast
    kwargs = {
        "lowpass_filter_width": 16,
        "rolloff": 0.85,
        "resampling_method": "sinc_interp_kaiser",
        "beta": 8.555504641634386,
    }
    lib_time = benchmark_resample_librosa(*args, res_type="kaiser_fast")
    f_time = benchmark_resample_functional(*args, **kwargs)
    t_time = benchmark_resample_transforms(*args, **kwargs)
    times.append([lib_time, f_time, t_time])
    rows.append("kaiser_fast")

    df = pd.DataFrame(times, columns=["librosa", "functional", "transforms"], index=rows)
    return df
def plot(df):
    print(df.round(2))
    ax = df.plot(kind="bar")
    plt.ylabel("Time Elapsed [ms]")
    plt.xticks(rotation=0, fontsize=10)
    for cont, col, color in zip(ax.containers, df.columns, mcolors.TABLEAU_COLORS):
        label = ["N/A" if v != v else str(v) for v in df[col].round(2)]
        ax.bar_label(cont, labels=label, color=color, fontweight="bold", fontsize="x-small")
降取樣 (48 -> 44.1 kHz)
df = benchmark(48_000, 44_100)
plot(df)
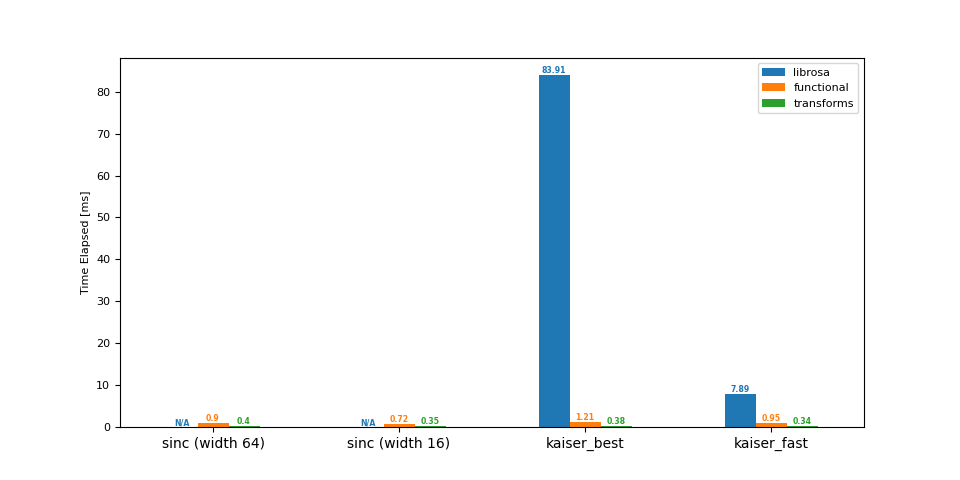
                 librosa  functional  transforms
sinc (width 64)      NaN        0.90        0.40
sinc (width 16)      NaN        0.72        0.35
kaiser_best        83.91        1.21        0.38
kaiser_fast         7.89        0.95        0.34
降取樣 (16 -> 8 kHz)
df = benchmark(16_000, 8_000)
plot(df)
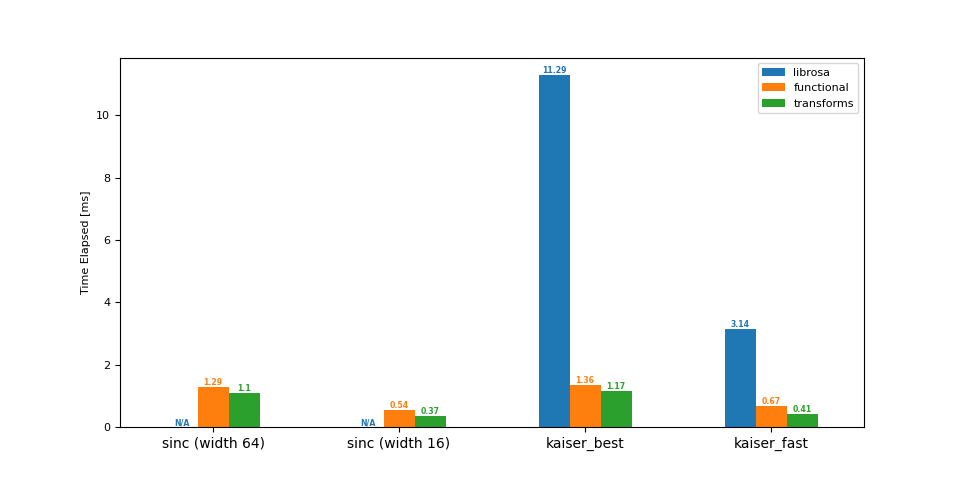
                 librosa  functional  transforms
sinc (width 64)      NaN        1.29        1.10
sinc (width 16)      NaN        0.54        0.37
kaiser_best        11.29        1.36        1.17
kaiser_fast         3.14        0.67        0.41
升取樣 (44.1 -> 48 kHz)
df = benchmark(44_100, 48_000)
plot(df)
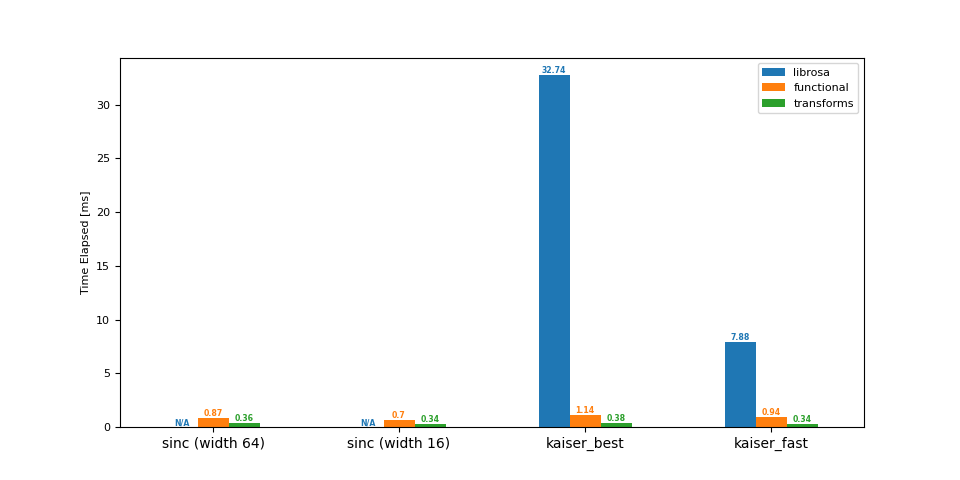
                 librosa  functional  transforms
sinc (width 64)      NaN        0.87        0.36
sinc (width 16)      NaN        0.70        0.34
kaiser_best        32.74        1.14        0.38
kaiser_fast         7.88        0.94        0.34
升取樣 (8 -> 16 kHz)
df = benchmark(8_000, 16_000)
plot(df)
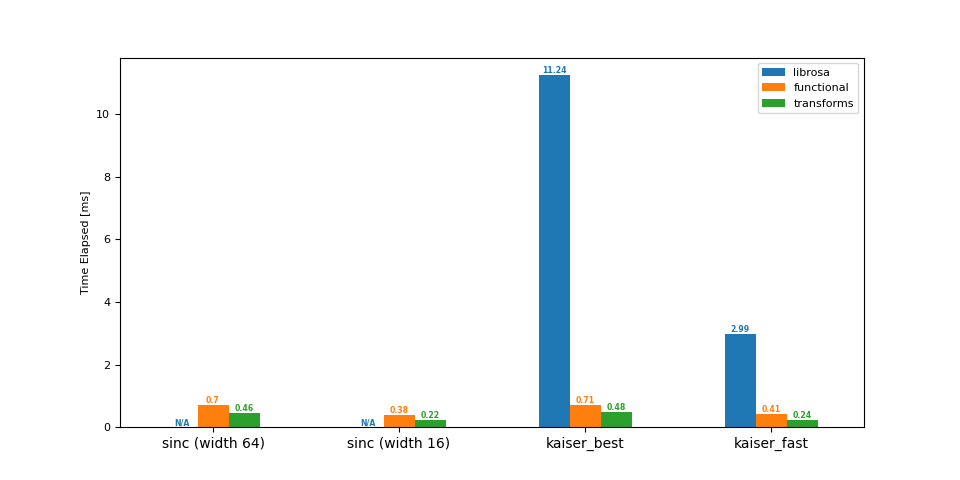
                 librosa  functional  transforms
sinc (width 64)      NaN        0.70        0.46
sinc (width 16)      NaN        0.38        0.22
kaiser_best        11.24        0.71        0.48
kaiser_fast         2.99        0.41        0.24
總結
詳細說明結果:
較大的
lowpass_filter_width會產生較大的重新取樣核心,因此會增加核心計算和卷積的計算時間。使用
sinc_interp_kaiser會導致比預設的sinc_interp_hann更長的計算時間,因為計算中間視窗值更複雜。取樣率和重新取樣率之間的較大 GCD 將導致簡化,從而允許較小的核心和更快的核心計算。
腳本的總運行時間:(0 分鐘 3.361 秒)
